The User Interface
Argos offers a content and feature rich, fast and easy to use user interface. Most of the commands are available from toolbar buttons, drop-down menus and pop-up windows, a few clicks away. 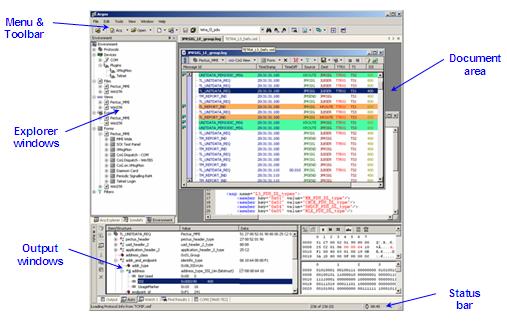
Besides the usual Windows application areas, like menu bar, toolbar and status bar, Argos has the following main areas:
MDI document area - where the protocol data windows, text and hex editors, message diagrams, help windows is opened
Explorer windows frame - a tabbed, dockable and auto-hide window with protocol and log file explorer, PDU element definition explorer, and device, protocol definition file, protocol post-processing definitions explorer tabs
Output windows frame - a tabbed, dockable and auto-hide window where the report, device plugin input/output terminals, serach and PDU filter reports, currently selected PDU tree view are shown.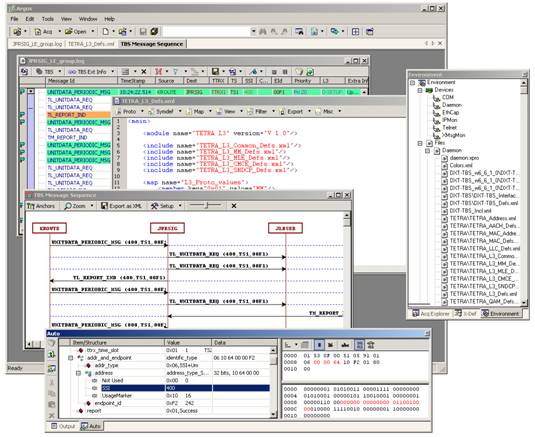 The Explorer and Output windows frames are detachable from the mainframe border and they can float inside or outside of the mainframe area, or they can be docked to a different position.
The Explorer and Output windows frames can be switched to auto-hide mode, when only their tab icons and title are visible. Moving the mouse over the tab area will show the corresponding window in its original size, and all the commands in it are available. Moving away the mouse from the window area will auto-hide again the window.
For smaller resolution laptop screens, the Economic mode maximizes even more the protocol data view area, with quick access to all menu commands. With the Economic mode button from the toolbar, both Explorer and Output windows are put to auto-hide mode, and the main menu is available as a drop-down menu in the main toolbar. The mainframe area is maximized for PDU view. Toggling the Economic mode button will restore the previous window configuration.
The MDI area hosts various types of document windows: 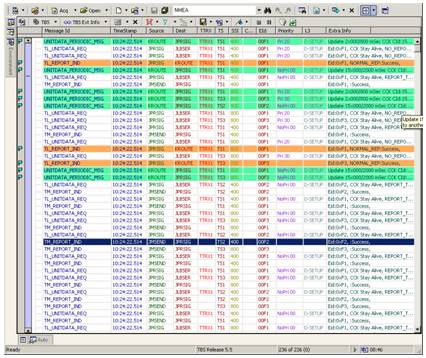
- Protocol data windows
- Message sequence diagram windows
- Simple text editors
- XML text editors for protocol language editing
- Hex editor
- HTML help windows
The Output windows frame can contain the following window types:
- Output window - simple read-only text window for general application status messages
- Auto window - the currently selected PDU in the protocol data view is shown here with members expanded, hexdump and bitdump
- Input/output device plugins terminal windows
- PDU filter reports
- Find-in-files reports
The main toolbar contains buttons with drop-down menus, with the following commands:
- Load previously used or selected protocol
- Create new acquisition, load previously used or selected log file
- Create new, load previously used or selected text, XML, or binary file in hex editor
- Save current document(s)
- Find in current document or find in files
- XMLizers
- Economic mode toggling
- Window navigation
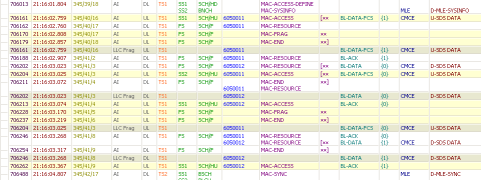
The protocol data document displays the analyzed PDUs in a multi-line and multi-column tree list view. The column configuration, width, color and and content is completely user definable using the XML protocol definition language. 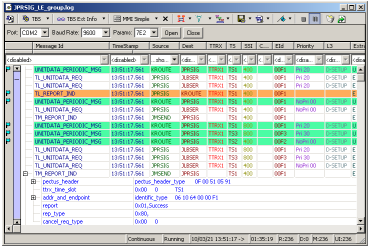
Each column cell can display one or more, formatted PDU member values. The last column is usually displays a formatted resume with the most important PDU members, which speeds up the protocol data overview and reduces the need for expanding the PDUs.
The protocol data view document has its own toolbar, with drop-down buttons, from where the user can
- select protocol specific commands,
- change the view or the input/output devices command form
- open message sequence diagrams
- configure PDU filters and filter reports
- configure PDU reassembling
- save and export view and PDU content
- bookmark PDU items
- start, stop and configure the protocol data acquisition
- empty and reload the view
The user can configure a filtered view of the protocol data by using the view filter combo-boxes from the top of each column. View filter profiles can be saved and loaded for individual or all columns.
The range bar on the left side of the window shows visually the amount of protocol data loaded from the input source or log file. By dag-and-dropping the top and bottom arrows and the area between, the user can control the amount of loaded PDUs, which in case of large log-files speeds up the visualization of the area of interest.
The mark bar on the leftmost side of the window indicates with small icons the PDUs marked with PDU filters and bookmarks. Moving the mouse over the icon shows a descriptive tooltip text about the mark.
The status bar of the PDU document window, if enabled, shows statistical and status information about the current acquisition and log file.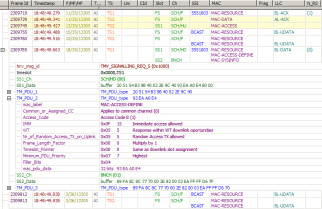
Each PDU in the view can be expanded in detail, where the PDU members are shown in a tree structure, with member name, numerical and/or symbolic values, with the colors as defined in the protocol definitions.
The currently selected PDU in the view is shown and expanded in detail, with hexdump and bitdump detail in the Auto output window. The selected PDU member's position is highlighted in the hexdump and bitdump.
Each PDU in the view can be opened in the PDU Editor window, which similarly as in the Output window, it is shown in hexdump and bitdump, but the user can also edit the hexdump and individual member's values and inspect the result of protocol decoding. The PDU Editor allows decoding of any hexdump with any of the PDU definitions.
Multiple PDUs can be selected and cut/copy and pasted to another PDU document window.
By opening a pop-up menu on a PDU, additional commands are available as jump to protocol definitions, PDU location in log file, copy cell and column content, with members, to clipboard in simple or formatted text, timestamp difference, set the limits of the range bar, and some of the commands available also in the toolbar.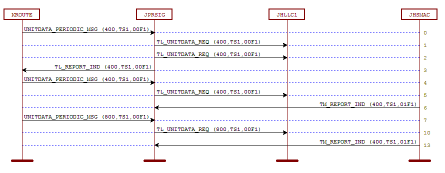
The user can simple or regexp search in the view content, in individual or all columns or in PDU members.
A list of selected or all PDUs can be used to generate message sequence diagrams. Each view can have one or more diagram defined using the XML protocol language.
The message diagrams can be zoomed, the anchors reorganized, and rxported to Microsoft Visio 2003 or later, XML compatible format.
For fragmented PDU members, various PDU reassembling rules can be defined using the XML protocol definition language. The starting, ongoing and ending fragments are indicated in the user interface, and after the last fragment is available, the fragmented PDU is reassembled, inserted as a new PDU in the view, and decoded as a whole PDU.
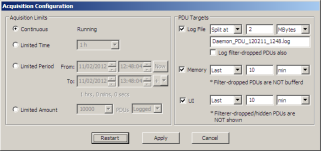
The protocol data acquisition an logging can be configured for continuous, time period or number of PDUs mode. The log files can be split by size, time or number of PDUs, and the storage to memory and user interface can be disabled or configured to use minimal resources. With these configurations, long time protocol data acquisition is possible.
PDU filter reporting can be enabled and configured to create reports during acquisition, which can be loaded afterwards and browsed for specific events.
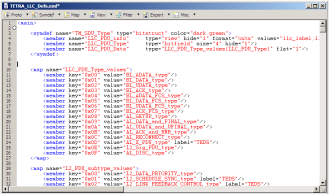 The Argos multi-document interface also hosts a hex, text and XML editor. The hex editor can be used to open and inspect and edit binary log files. The text editor can be used for any text mode editing, and especially text based log files.
The XML editor is for viewing and editing the XML protocol definition files. It has its own toolbar for inserting XML protocol definition element templates, and various extra commands in the pop-up menu, which facilitates the navigation and development of the XML protocol definitions, like jump to definition, jump back-track, help on keyword, insert colors from color pickers, etc.
More user interface, protocol analysis and interfacing features of Argos are presented here.
Popular tags: Analyzer, Monitor, Sniffer, Decoder, Custom Protocol, Custom Protocol Analyzer, Proprietary Protocol, Proprietary Protocol Analyzer


