Argos for Tetra Air Interface Analysis
Argos Tetra analyzer supports the analysis of latest Tetra Air Interface protocols as defined in the ETSI 300 392-xx standards.
The downlink and uplink AI PDUs are decoded from proprietary or open format TMV transport messages.
The analysis covers both Tetra 1 and Tetra 2/TEDS AI messages.
The present definitions covers the following Tetra AI protocol layers:
- MAC – Media Access Control
- LLC – Logical Link Control
- L3 - Layer 3
- MM – Mobility Management
- MLE – Mobile Link Entity- SNDCP
- SNDCP – SubNetwork Dependent Convergence Protocol
- CMCE – Circuit Mode Control Entity
- SS – Supplementary services
- SDS content decoding:
- Text Messages (7 bit, 8 bit, 16 bit encoding)
- LS - Location System
- LIP - Location Information Protocol
- NMEA
- RUA - Radio User Assignment
- UDH - Message with User Data Header
The Tetra analyzer can be used for development, testing and troubleshooting deployed Tetra networks and equipment.
Users can easily integrate the Tetra analysis into their proprietary environment, analyze existing log files or using own or 3rd party hardware.
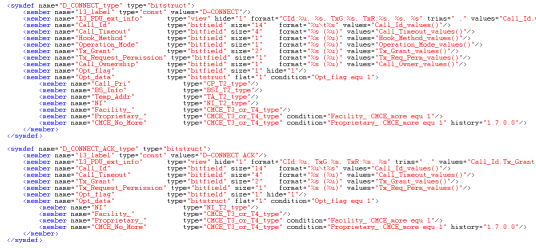
 The Tetra acquisition, analysis, post processing and presentation is completely defined by a proprietary and simple XML Protocol Definition Language, in clear or encrypted text files, and can be easily integrated with other open standard and proprietary protocols.
Check our contacts on the support page, to find out how to integrate into your Tetra environment.
The analyzer software can decode the Tetra packets from clipboard, offline log files or real-time traffic, through one of the provided input device plugins or through a custom input device plugin connected to a proprietary or 3rd party acquisition hardware. The input format can be binary or text.
The input data can be logged to an open proprietary format binary log file.
The acquisition can be configured for continuous mode or for limited amount or time. For long time acquisition, the log files can be split based on size, time or amount of records.
Each Tetra PDU record represents the content of the logical channels for each timeslot or subslot, for uplink or downlink direction.
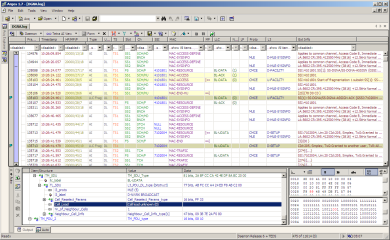
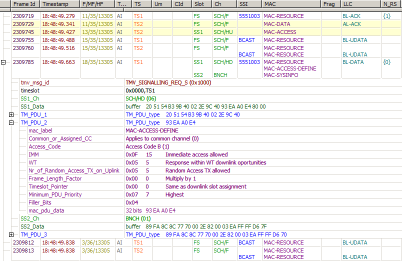 The result of the PDU analysis is presented in a multi-line tree-list view, where each row represents one timeslot and direction. For each full or sub-slot, the content of each MAC frame is represented in different line. For each PDU and line there is a column where the most important parameters of the PDUs are shown: logical channel name, SSI, MAC, LLC and L3 protocol identifiers, fragment indicators for MAC and LLC fragments, LLC sequence numbers. Other parameters can be shown by toggling column visibility or by customizing the view definitions.
Each PDU has an extra information column, where a formatted string with the most important parameters are shown for each individual PDU from all protocol levels. The user can immediately see the relevant information, without need to expand always the PDU.
Each PDU can be expanded to its relevant or full details. The PDU members are represented in a tree structure, with the name and a its formatted value with numeric and textual representation. There are several detail levels available, where some of the PDU members can be visible or hidden. Usually, presence, optional and reserved member bits are hidden, but the user can turn them on, if needed.
The currently selected PDU is always expanded in the Auto utility window.
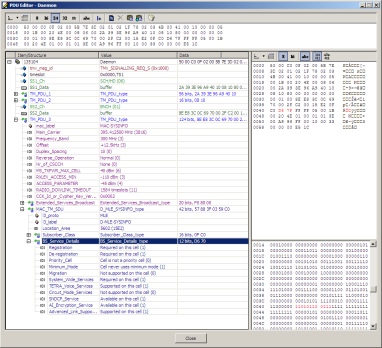 Each PDU in the view can be opened for editing, where the updated hexdump or member values are immediately analyzed.
The byte and bit positions of the selected PDU member are also highlighted in the Auto window and PDU edit dialog.
Various PDU filters are defined for the Tetra AI PDS, which can mark, hide or drop some of the PDUs. Frequently occurring AI PDUs, like NULL and broadcast PDUs can be hidden, so the view is not overloaded with large amount of unnecessary information. Special conditions or grouping can be marked with different colors and an indicator is displayed beside the PDU with explanatory text.
The PDU filters are definable by the XML Protocol Definition Language, the user can add new filters or modify the actual ones.
PDU filter report can be done on request or on fly, which offers a faster navigation between the marked PDUs in the log. The report can be done over multiple log files, and can be saved and reloaded for later analysis.
 A view filter can be enabled for each column, from where the user can select the items shown in the view, obtaining a filtered view on specific criteria. The view filter configurations can be saved and reloaded individually and for all columns.
The user can search by simple text or regexp in the column or PDU member content.
The user can also cut, copy and paste each PDU.
Bookmarks can be toggled for each PDU, they can be commented, exported and imported. They are saved and loaded automatically for each log file.
A selected or full content of the view can be exported to user definable binary or text format.
The user can copy to clipboard or export to text file, the content of the view in simple or formatted text, with or without hexdump and member hierarchy.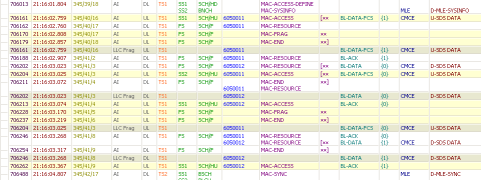
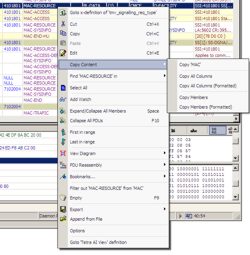
Fragmented MAC and LLC PDUs are reassembled and inserted into the view and decoded as a complete PDU. They are highlighted with different color.
The packet data content, usually reassembled, is further decoded as IP traffic and the IP protocol specific info is shown in the extended information column.
There can be multiple views defined, each of them presenting a different view and content of the same data, user definable by the XML Protocol Definition Language.
Currently, the most important views are the "Tetra AI view", fine tuned for AI PDU specific information, and the "Tetra AI IPv4 View" with a IP traffic from the Air Interface only and more IP specific presentation. The IP traffic can be exported to Wireshark compatible log file.
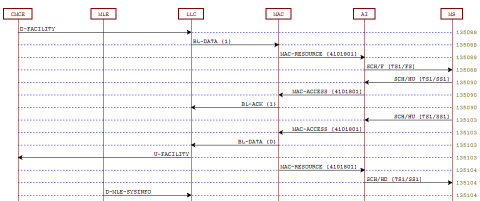 The AI messages, all or a selected group, can be represented in message sequence diagrams, between L3, L3 entities MM, MLE, CMCE, SNDCP, Air Interface and Mobile Station. The diagram can be exported to Microsoft Visio XML compatible format.
On top of the view, a command form can be shown and used to command the input/output device for data acquisition. The content and outlook of the command form is user definable by the XML Protocol Definition Language.
For more details of the analyzer features check the context specific articles.
Popular tags: Air Interface, Tetra Protocol Stack, Tetra Network, Packet Data, Tetra Software, Tetra Radio, Tetra Terminal, Tetra Base Station, Tetra IOP


