
Tetra terminal monitoring using the Argos protocol analyzer
A typical connection of Tetra mobile terminal or Tetra modem to PC is through it's PEI interface (Peripheral Equipment Interface) through a serial data cable, as presented in the picture.

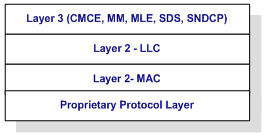
On this interface, beside the AT commands, the Tetra Air Interface Layer 2 (MAC or LLC) can be monitored, embedded into a proprietary protocol layer, which contains additional information like uplink/downlink direction, signal levels, CRC checks, etc.
The data format on this interface can be new-line delimited text mode hexdump, or a binary Xon/Xoff protocol as well.
Terminal developers can use a higher bandwidth interface, for development purposes and internal message monitoring. Such interfaces can be high speed serial, USB, IP connection. An SSH, Telnet or simple MMI connection can be opened, through which, using a custom protocol transport layer, any message between Tetra Air Interface stack SAP (Service Access Point), internal threads, processes and applications, can be monitored, sent over to Argos, and decoded in real-time, or logged for off-line analysis.
A simple custom format for LLC PDU log from Tetra terminal is presented bellow: direction, timestamp and the LLC hexdump:
DL 11:28:20.362 24 70 39 C0 14 C1 2A E2 87 D8 00 00
DL 11:28:28.757 24 60 39 DC
DL 11:28:32.540 24 70 3A 00 14 C1 2A E2 87 D8 00 00
DL 11:28:41.169 24 60 3A 1C
UL 11:28:54.831 59 73 80 82 12 00 05 94 F8 00 2C A8 79 6A 93 27 80 00 00 00
DL 11:28:55.050 11 B3 70 4C 09 80 01 65 38 00 00 00
UL 11:28:55.050 30 00 00 00
DL 11:28:56.582 24 70 3A 40 14 C0 00 00
DL 11:28:58.692 24 60 3A 5C
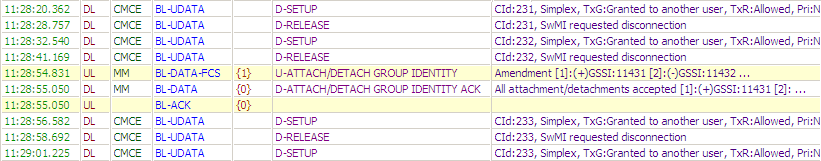
The Tetra PDUs decoded by Argos is shown in the next picture:
An example of expanded PDU hierarchy is shown bellow: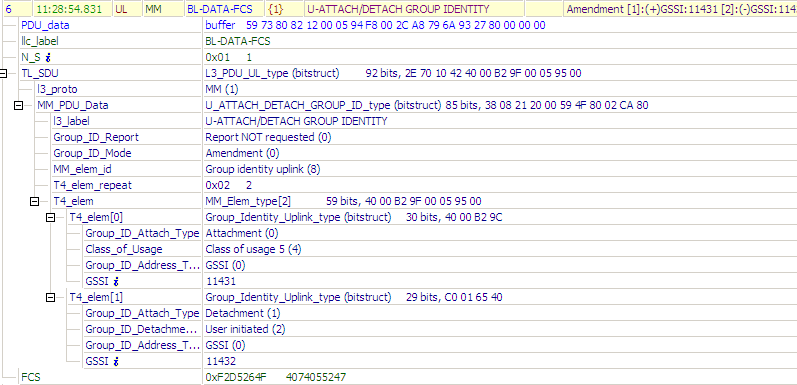
In terminal development, the terminal applications, using custom and Tetra protocol stacks, can be also executed in a simulated environment, on the same or on a different computer and operating system, Windows, Linux or real-time embedded OS.
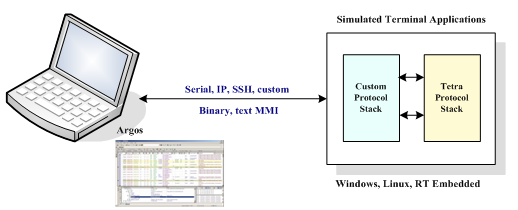
The simulated environment's internal message logging can be connected to one of Argos's input input interfaces, for example over a simple TCP/IP or a Telnet/SSH connection.
The proprietary and Tetra protocols stacks can be decoded and viewed in the same analyzer window, at the same time while debugging or executing module testing.
The Argos monitoring window can contain fully customizable control forms, through which the user can send monitoring commands to the monitored device or application, like start or stop monitoring, enable disable different levels of traces, or any user command.
